Affiliate links on Android Authority may earn us a commission. Learn more.
Android Studio 4.1 - New features for devs

Android Studio 4.1 made it onto the stable channel last month, bringing a number of useful new features for Android developers. There are some interesting inclusions this time around, so read on to see what you need to know!
Embedded emulator
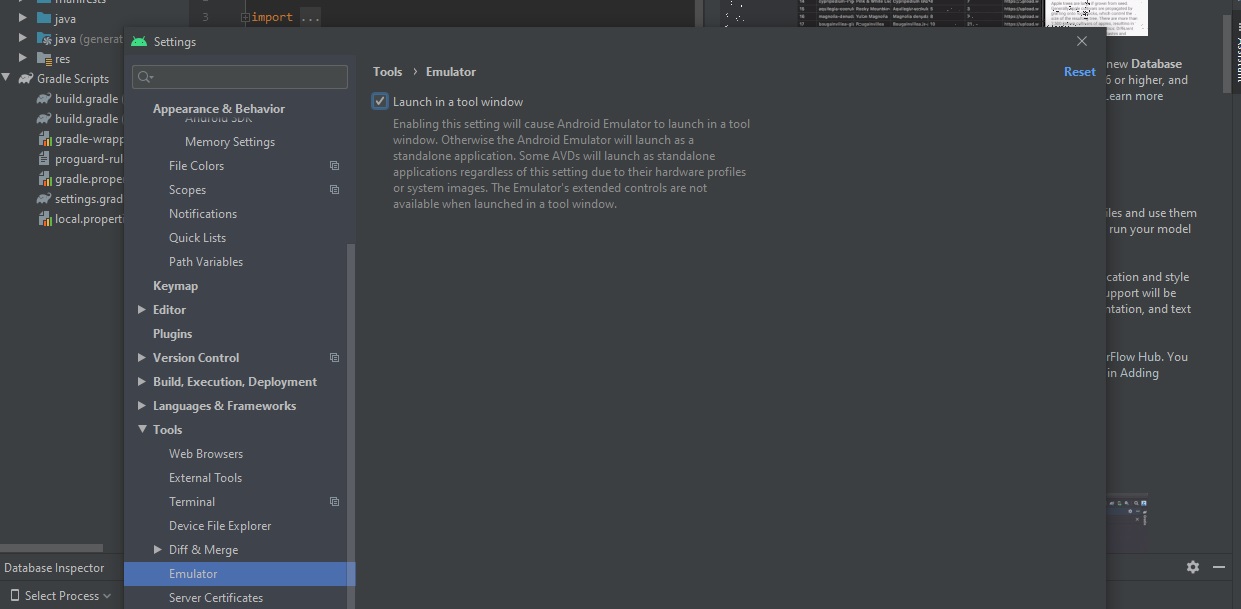
One of the most interesting updates comes to the Android emulator, which is now built right into the IDE itself. In other words, the emulator no longer opens as a separate app but rather in a tool window. This is said to “save screen real-estate” for all us peasants working on sub 4K, 42” monitors.
See also: Android Studio tutorial for beginners
While this is mostly a cosmetic change, it does make the experience feel more cohesive and intuitive. It’s also easier to monitor code while the app is running. It is a great stride toward a more integrated and seamless experience.
The feature is not turned on by default, however. To access it, you first need to update your preferences by going to File > Settings > Tools > Emulator > Preferences. Select “Launch in a tool window.” It’s probably worth mentioning that this crashed for me more than once, however.

The emulator also now includes more support for foldable devices: now supporting numerous fold designs and even allowing you to test different hinge angles!
Database inspector
The new database inspector lets users inspect, query, and modify databases in an app while it runs. This is supported on devices running API level 26+.
To begin, run the app and then choose View > Tool Windows > Database Inspector. This works whether your app uses the Jetpack Room library or SQLite directly. You can even modify values using the Inspector while the app is running.
Dagger navigation support
Dagger is a library for dependency injection on Android. In Android Studio 4.1, it’s now easier to jump between Dagger code and your main project using gutter actions and the beefed-up Find Usages window.
Material design components
This is a useful update that should make it easier for developers to conform to the material design guidelines that Google provides.
Essentially, the default templates found when starting a new project will more closely resemble the recommended stylings from Google. Projects depend on com.google.android.material:material in the Gradle build file.

Other changes also make life slightly easier: color resources now use literal names, for example.
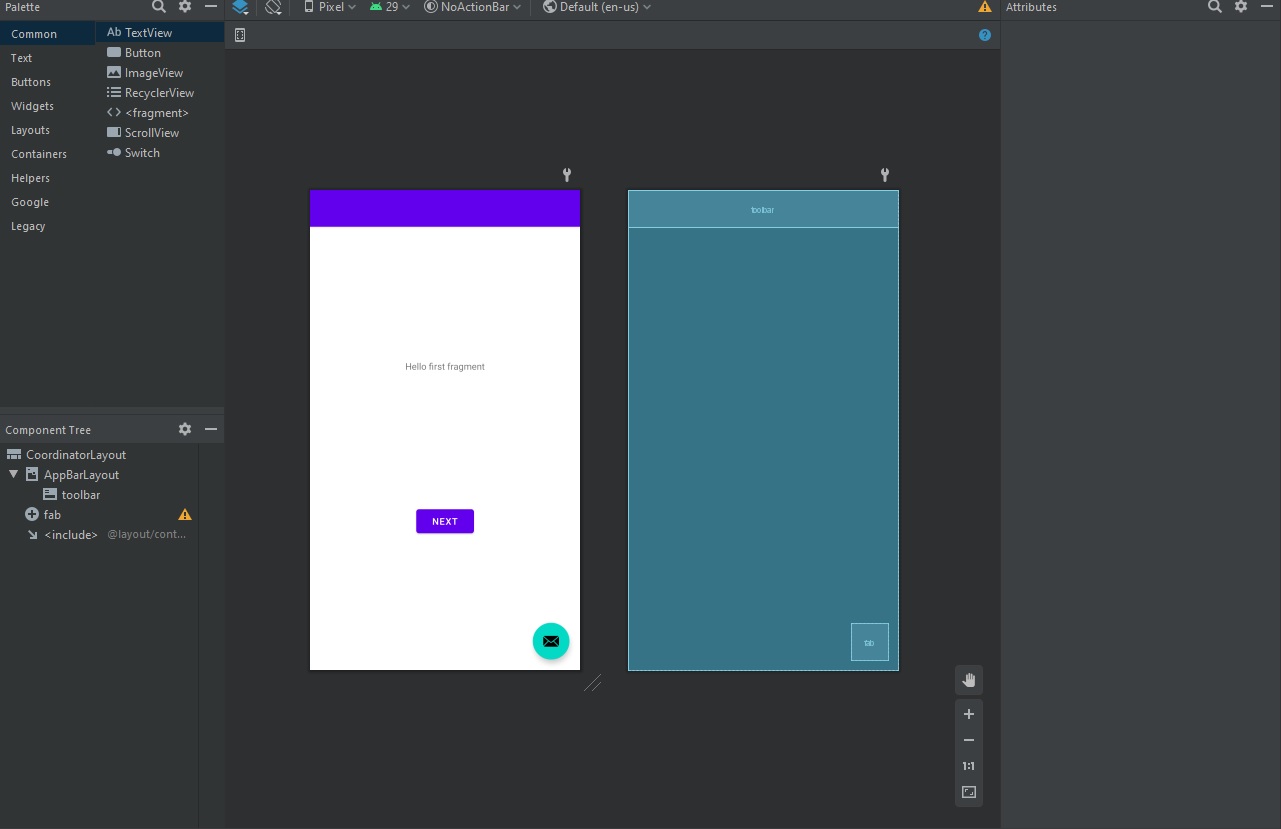
Most importantly, the style templates more closely match Google’s most recent Material Design “2” sensibilities rather than the old MD1 and AppCompat themes. The differences aren’t night and day, but seeing the very dated-looking “Next” button replaced is certainly nice.
Native memory profiler
The Native Memory Profiler is built into Android Studio 4.1’s Memory Profiler and allows users to track memory allocations and deallocations of objects. This gives developers access to the objects’ size and number to assist with debugging memory issues.
TensorFlow Lite models
TensorFlow Lite allows developers to integrate machine running algorithms on-device. Android Studio 4.1 makes it easier to import these models directly. Android Studio will generate classes that can run the model with less code and better type safety.
Pre-trained models with metadata are available on the TensorFlow Hub and you can also add your own TensorFlow Lite models.
To get started, download the .tflite model file from the model details page. Choose a model with metadata. Then open the TnesorFlow Lite model import dialogue in Android Studio. To do this, navigate to File > New > Other > TensorFlow Lite Model.
Now choose the .tflite model file and click finish. The model will be imported and placed inside the ml/ folder of your project. Clicking on this file will open a model viewer to reveal further detail about the model.
There are more new updates and features to help improve workflow, especially . Check out the official blog post from Google for the full details.
Thank you for being part of our community. Read our Comment Policy before posting.